Service graphs
|
|
|
|
Graph Information
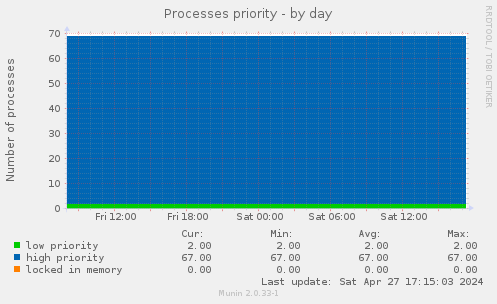
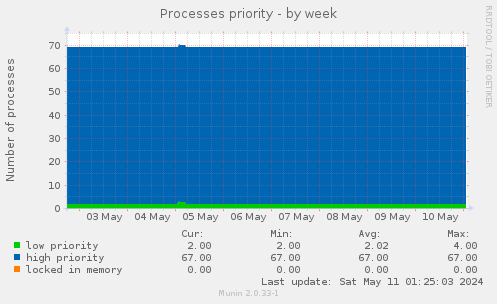
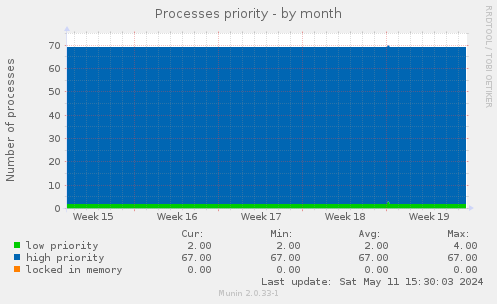
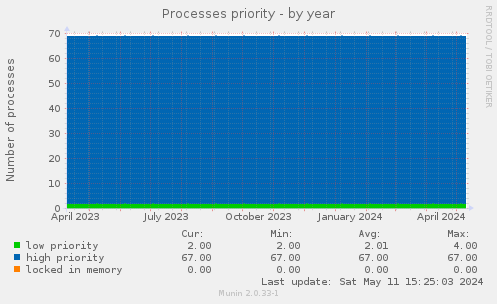
This graph shows number of processes at each priority
| Field | Internal name | Type | Warn | Crit | Info |
|---|---|---|---|---|---|
| low priority | low | gauge | The number of low-priority processes (tasks) | ||
| high priority | high | gauge | The number of high-priority processes (tasks) | ||
| locked in memory | locked | gauge | The number of processes that have pages locked into memory (for real-time and custom IO) |